U/V chinese tracking generator and Spectrum
analyser
I saw one of these for sale on ebay and at the price I thought it cheap enough to purchase play with then onsell when I was bored with it.
Specification:
- Frequency range: 136-173MHz
400-470MHz
- Spectrum dynamic range: -127dBm ???? --- 0dBm ????
- Resolution: 1dB
- Tracking source output power: ≈ -38 dBm
- Interface: BNC
- Power: need external DC 8 --- 12V
I ordered one and in about 3 weeks it turned up in new Zealand ,it came with absolutely no instructions and no 12v plug pack so I was on my own
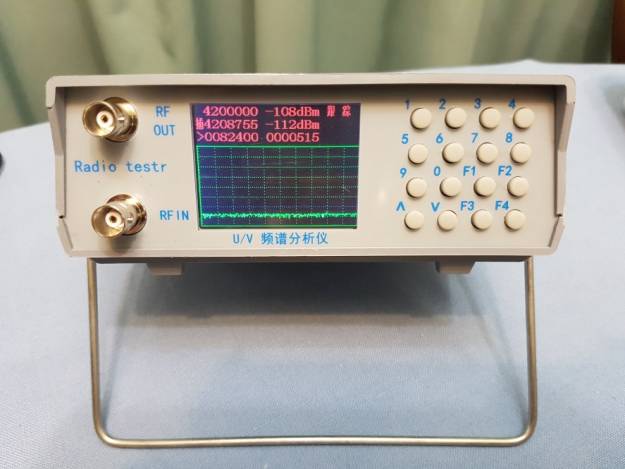
The first thing I noticed was the weight of the unit it was so light , a plastic box ,keyboard display and two BNC connectors .I duly found a plug pack and connected it and the unit booted up
The second thing I did was find a screwdriver and open the box up .to find it was 95% empty! The whole unit was contained on one pc board attached to the front panel with integrated BNC connectors , the display is quite bright, not to onerous to read but I suspect would be difficult in the sun for my old eyes .
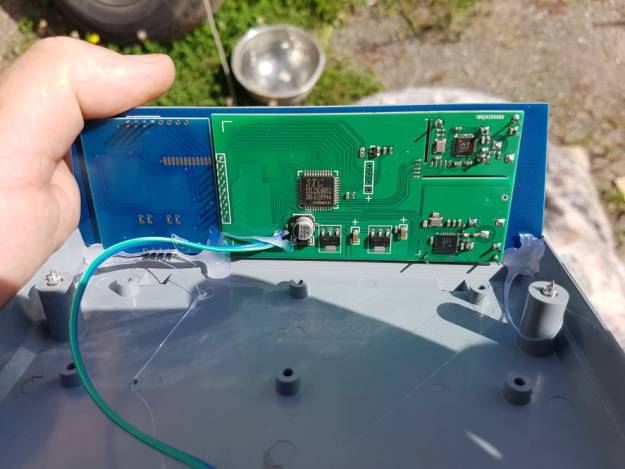
RF wise the transmit and receive are based on LSI dual band radio ic’s A Sx1278 for the receiver and a 1846s as the transmitter ( used in a lot of dual band UHF chinese transceivers ).The brains of the outfit is an STC15L2K60S2 28I LQFP44 which controls the LCD display, Keyboard and the two RF chips . the hollow box could easily contain some sort of battery pack eg 8.4 to 11v so the unit could be used remotely .
Controls’
F1 controls the cursor , it position selects the aspect you are going to alter via the keyboard ,F1 sequentially steps around the centre frequency and the sweep widths inputs .
Sequential Long press on F1 switches between spec an and tracking combination Unfortunately the text is in chinese on screen so the top right indication of function mode is as useless as titts on a bull for those who cant read chinese ! Spec An mode the grass is about 10db lower (-114dBm) than in tracking generator mode (-111)
You select the top left line with the F1 cursor and type in the wanted centre frequency of the LCD display ie 4220000 is 422.0 MHz . The level of the programmed received displayed signal is shown to the right of the centre frequency in –dBm , the no signal base line on my unit hovers around –109 dBm .
Toggle F1 to the third line and this allows you to program the sweep width , I find that I toggle via F1 to the right hand side of the third line and do all my sweep control input programming there. You must always program in 7 digits then the machine works .ie 0000015 is a narrow sweep ,this figure can be incremented up or down using the arrow keys. all zeros 0000000 is no sweep !
I put it on the test bench and connected the Agilent E4407 spectrum Analyser to the rf out and the Agilent N9310A signal generator to the rf input .
The chinese tracking generator and spectrum analyser combination is activated by pressing button labelled F1 a Long press turns on the combination or another long press turns on just the Spectrum Analyser function .
Note the frequency coverage in the specifications (although I found it would go outside these parameters ).
I placed it in tracking mode and watched the output on my spec An . RF output was –25 dBm on VHF and –23.4dBm on UHF .and of constant level …
The Max displayed signal is –40 dBm . And there is no way to change the output levels or screen reference etc I selected the cursor the top line with F1 key and then typed in 1450000 into the unit ,this puts the centre of the screen to 145 Mhz I then selected the third line right hand group of numbers with F1 and typed in 0000300 for a narrow sweep .
I connected an old low insertion loss 2m duplexer cavity to the system ,and immediately found the rf output at –25 dBm is too much for the –40 dBm display so I had to insert a 15 dB 50 ohm attenuator in series with the signal path to enable me to see the filter response in entirety on the screen .

In hindsight it would be better to use a 5 dB at one port and a 10 dB at the other port and at least the filters would have some sort of 50 ohm termination .
Make sure you use good quality double screened coax leads if possible as leaky coax will show up as the display moving up and down as you play with the connecting leads..
Put the passband peak at the centre frequency of the screen and you can read off the insertion loss .( after having calibrated with your cables and with 15 db in line)
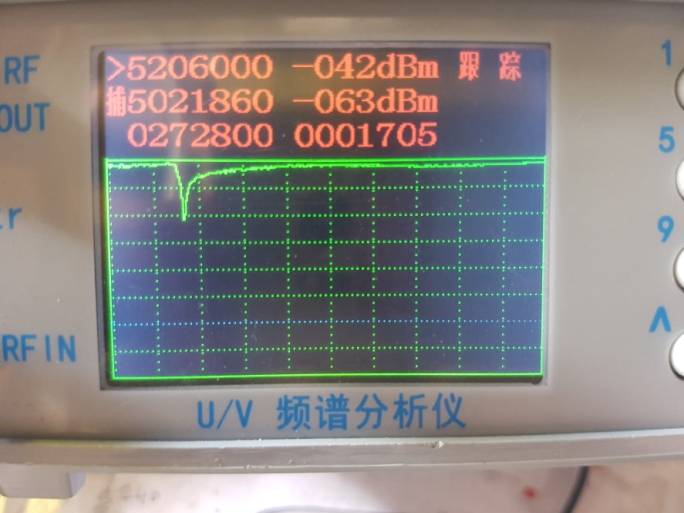
the notch frequency and depth will show up in the display ,in the above case ( -40 minus –95 = 55 dB ) I guess taking out the 15 dB pad will enable you to push the system deeper by another 15 Db if needed !!
See the “ passband to Notch” is 2.2800 MHZ (147.2800 – 145.0000 = 2.28 MHz ) If you leave the cursor in the 0000300 you can increment the sweep width using the up and down arrows ,remember 0000000 is no sweep if everything goes pear shaped just type in the previous sweep width . F2 is a backspace key if you make an error typing in a number
and f3 and F4 increment and decrement the centre frequency by a MHZ per key press . Remember to place the “arrow” cursor in front of the line you wish to alter
On testing at UHF , I managed to achieve 1.8 MHz ( 0000005) and 188.75 MHz span ( 004000) and various scan width in between by incrementing with the arrow keys VHF from 1.65 MHz to 32 MHz total span .
I did check the display amplitude accuracy with my signal generator and it is at least plus or minus 1 dB ,so its very good though I could really only measure accurately slightly over 50 db range before the digital readout display became erroneous . ( don’t forget you still have 15 dB to play with if needed )
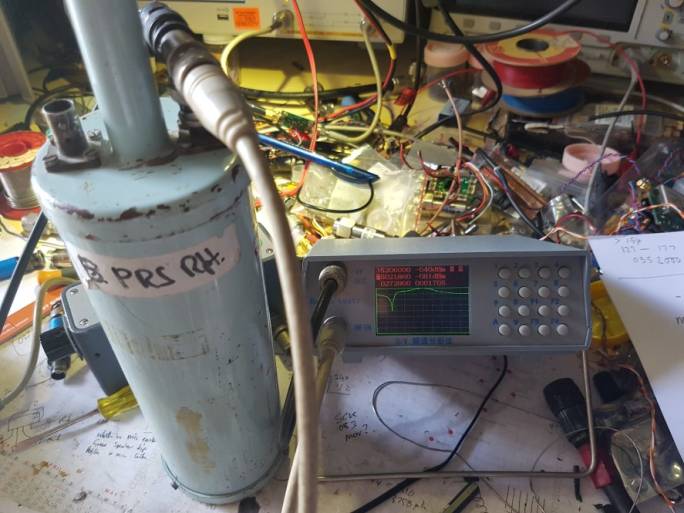
I did a test on uhf with a coaxial filter , as well ,I still have to put 15 dB in series to see the top of the response
Note 520.600 MHz !!! centre frequency and insertion loss at that frequency of approx 2 dB ,rejection notch depth 21 dB at a frequency of 502.186 MHz .
There is no reason why you cannot perform return loss measurements with a good RL bridge and this instrument
Spectrum Analyser mode has some short comings .Because the receiver steps in increments across the spectrum there are distinct potential gaps in coverage where you will see no carrier on screen despite you know it actually being present .Unless one of the stepping increments lands right on the carrier frequency it will be stepped over and not be seen ( if the Analyser receiver VCO was ramped linearly and not in digital steps , then you would eventually pass across the carrier signal , and it would be seen ..so beware !!)
However in tracking mode the micro tells both the transmitter and receiver to step at exactly the same frequency and rate then the spectrum analyser is always on the same frequency as the transmitter so you always see the trace without any gaps
So Not bad for a couple of hundred dollar toy however what it really needs inside is 1 Kg of lead to hold it steady on the bench then your coax leads don’t flick the unit all around the bench as you play with the coax cables !!
Description: in “chinglish”
came on website of unit on ebay
- The upper right corner of the spectrum shows
the spectrum mode,the display tracking for the spectrum plus tracking mode
- The first line shows
the center frequency center frequency power
- The second line captures
the strongest or weakest frequency, or the specified frequency and power (shows
the capture of the strongest signal in capture mode, the acquisition of the
weakest signal in capture plus capture mode, Adjust the diplexer steps ")
frequency and power)
- The third line of the frequency range (center
frequency plus or minus) frequency step
F1: cursor movement center frequency, frequency range,step cycle
selection (long press to switch between spectrum and tracking mode)
F2: Backspace
The cursor points to the center frequency: Numeric keys direct input or up and
down keys to step to adjust the frequency
F3 F4 Adjust the frequency in 1M
The cursor points to the frequency range: the value is centered on the center
frequency plus or minus the range,for example: 0128000 as the center plus or
minus 12.8 M
That is 25.6M range
Enter the number keys directly up and down keys to increase or decrease the
range,
The cursor points to the step: the number keys directly input or the up and down
keys to adjust the step change in 5K scan range will be slightly changed to fit
the size of the grid